eporting in ConfigMgr 2012 is a powerful way to get alot of information about almost everything in your environment. But sometimes the built in reports that Microsoft has provided is not enough. If you search on google for how to create a custom report you’ll get several great articles/posts on the subject. What most of them lack though is how to create the actual query part of the report. You could of course search the internet and hope that somene else has already published a query for exactly what you’re trying to accomplish, but most of the time you’ll not find what you’re looking for. In this post I’ll walk through the steps to create a custom report for usage in the ConfigMgr console, and the best part, you don’t need any knowledge on how to write SQL queries.
OVERVIEW
- Environment setup
- Create an in-console Query
- Locate the SQL query statement
- Create a custom report
- Run the custom report
ENVIRONMENT SETUP
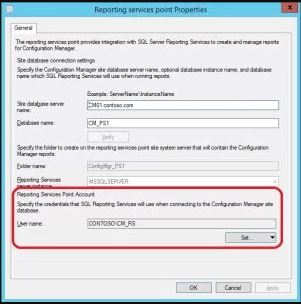
In order to use the Reporting functionality in ConfigMgr, you’ll need to have the Reporting Services Point Site System role installed on the SQL server for your Primary Site server. In my lab environment I’ve got a Primary Site server called CM01.contoso.com where the SQL server is running locally. In my case I’ve installed the Reporting Services Point on CM01.contoso.com. When you install the Reporting Services Point, it’s recommended to use a dedicated service account as the Reporting Services Point Account. The picture below shows that the Reporting Services Point Account is set to a domain account called CONTOSO\CM_RS.
Additionally my environment looks like this:
- ConfigMgr 2012 R2
- SQL Server 2012 SP1 with SQL Server Report Builder 3.0
CREATE AN IN-CONSOLE QUERY
You may think, why are we creating an in-console Query first? The answer is simple, we will be using the this query to get the correct SQL query statement that is needed in order to create a custom report. In this post we’ll be creating a simple Query to get all devices with any version of Silverlight installed.
1. Go to the Monitoring node, right-click on Queries and select choose Create Query.
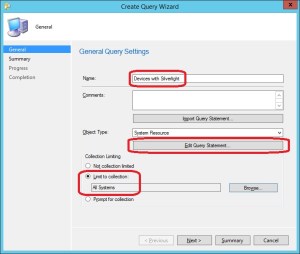
2. In the Name field, give the new query a name e.g. Devices with Silverlight.
3. Limit the collection to a collection that is suitable for your environment. In my lab I’ll just choose the All Systems collection.
4. Click on Edit Query Statement.
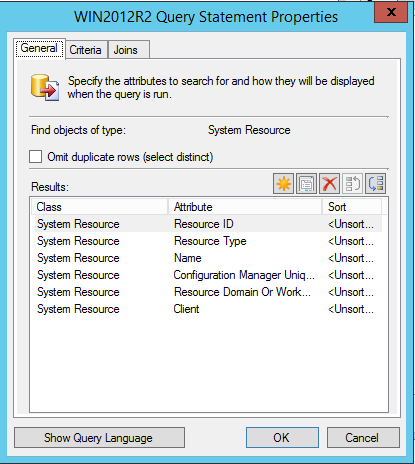
5. Click on Show Query Language and paste the following WQL query into the Query Statement field:
|
1
|
select SMS_R_System.Name, SMS_G_System_ADD_REMOVE_PROGRAMS.DisplayName, SMS_G_System_ADD_REMOVE_PROGRAMS.Version from SMS_R_System inner join SMS_G_System_ADD_REMOVE_PROGRAMS on SMS_G_System_ADD_REMOVE_PROGRAMS.ResourceID = SMS_R_System.ResourceId where SMS_G_System_ADD_REMOVE_PROGRAMS.DisplayName like "Microsoft Silverlight" |
This post will not cover the basics of creating a Query. If you’ve never creating a query before, I suggest that you read this.
6. Click OK and then Next. Click Next again on the Summary page and then click Close.
LOCATE THE SQL QUERY STATEMENT
Now that we’ve created the query to get devices that has Silverlight installed, we need to get our hands on the SQL query statement. When you are working in the ConfigMgr console, almost anywhere you click you’re querying the database for information. This information is being collected by the SMS Provider and sent back to be shown in the console. So if we were to run our newly created query from the ConfigMgr console, we’d ask the SMS Provider to get the results from our SQL server. When we create a in-console Query, it’s being generated as a WQL query (WMI Query Language) which cannot be used to get information from a SQL server directly. Now, here’s the really awesome part. Since the SMS Provider is a WMI provider, the SMS Provider needs to interprete and convert the WQL query into a SQL queryinstead. This conversion can be found in the SMSProv.log file, located in C:\Program Files\Microsoft Configuration Manager\Logs if you’ve installed ConfigMgr 2012 in the default location.
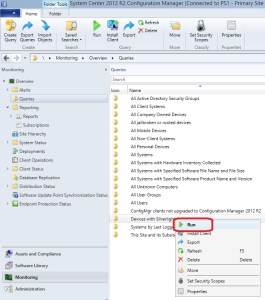
1. In the Monitoring node, right-click on the newly created query that we called Devices with Silverlightand select Run.
2. Open SMSProv.log with CMTrace.exe and look for a row starting with Execute SQL. You may have to scroll up a bit to find it.
3. Compare the row with the WQL query we used earlier:
WQL:
|
1
|
select SMS_R_System.Name, SMS_G_System_ADD_REMOVE_PROGRAMS.DisplayName, SMS_G_System_ADD_REMOVE_PROGRAMS.Version from SMS_R_System inner join SMS_G_System_ADD_REMOVE_PROGRAMS on SMS_G_System_ADD_REMOVE_PROGRAMS.ResourceID = SMS_R_System.ResourceId where SMS_G_System_ADD_REMOVE_PROGRAMS.DisplayName like "Microsoft Silverlight" |
SQL:
|
1
|
select all SMS_R_System.Name0,__System_ADD_REMOVE_PROGRAMS0.DisplayName00,__System_ADD_REMOVE_PROGRAMS0.Version00 from vSMS_R_System AS SMS_R_System INNER JOIN Add_Remove_Programs_DATA AS __System_ADD_REMOVE_PROGRAMS0 ON __System_ADD_REMOVE_PROGRAMS0.MachineID = SMS_R_System.ItemKey INNER JOIN _RES_COLL_SMS00001 AS SMS_CM_RES_COLL_SMS00001 ON SMS_CM_RES_COLL_SMS00001.MachineID = SMS_R_System.ItemKey where __System_ADD_REMOVE_PROGRAMS0.DisplayName00 like N'Microsoft Silverlight' |
If the row you’ve located seems to be the correct one, copy the contents of the whole row into e.g. Notepad.
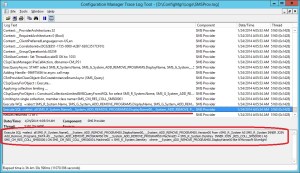
4. In Notepad, remove the part where it says Execute SQL =. You now have the full SQL query statementwhich can be used to create custom reports. Save this SQL query statement for later usage.
CREATE A CUSTOM REPORT
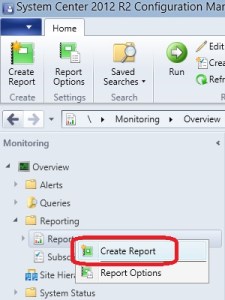
1. In the Monitoring node, expand Reporting, right-click on Reports and choose Create Report.
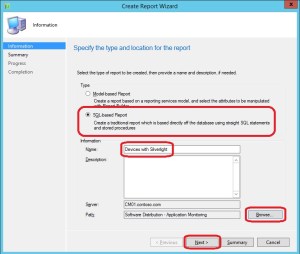
2. On the Information page select SQL-based Report as Type.
3. In the Name field, name the report e.g. Devices with Silverlight.
4. Click on Browse and select a folder to store the custom report. In this example I’ve choosen Software Distribution – Application Monitoring. This might not be the most appropiate place, but it will have to do. When ready, click Next.
5. On the Summary page, click Next.
6. On the Completion page, click Close.
7. When you’ve clicked on close, Report Builder will launch.
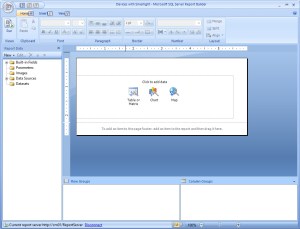
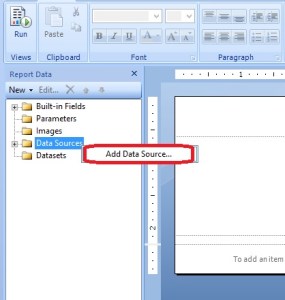
8. In the left pane, right-click on Data Sources and select Add Data Source.
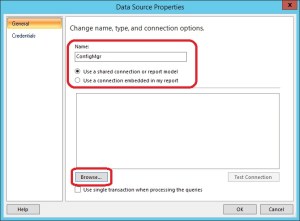
9. In the Name field, enter ConfigMgr.
10. Select Use a shared connection or report model and click Browse.
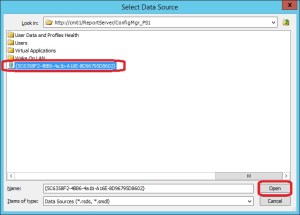
11. Double-click on ConfigMgr_<site_code>, scroll to the end and select the item that looks like a GUID. Click on Open.
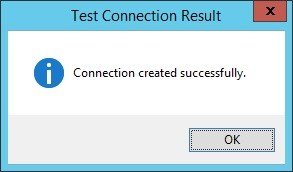
12. Click on Test Connection to see if it works. If the connection was successfully established, you’ll see the following message:
13. In the Data Source Properties window, click on OK.
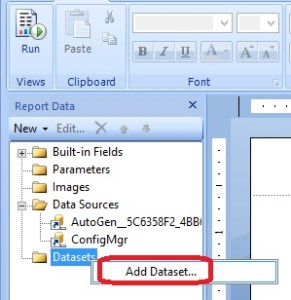
14. Right-click on Datasets and choose Add Dataset in the left pane.
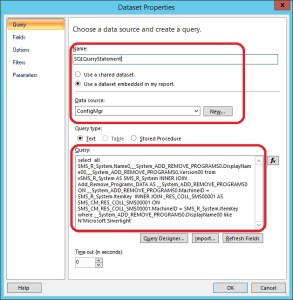
15. In the Name field, enter SQLQueryStatement (can be whatever you want, but no spaces or special characters). Select Use a dataset embedded in my report. Select the ConfigMgr item from the Data source drop down. In the Query field, paste the saved SQL query statement from earlier.
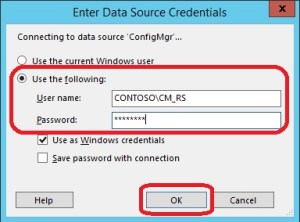
16. Click on Refresh Fields. In the Enter Data Source Credentials window that pops up, enter the password for the Reporting Services Point Account (see note about this account in the beginning of this post). Click OK.
17. At this point you’ll most likely get an error message like below. If you didn’t get an error, click OK and skip the next part and jump directly to step 18.
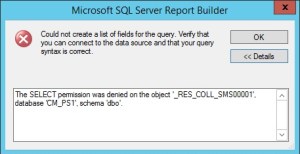
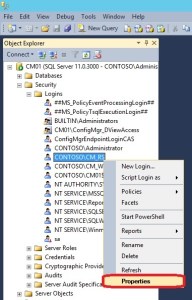
From the details of this error message, we can see that there is a permissions issue. In order to resolve this, we need to give the Reporting Services Point Account the permissions to read from the database. Leave all the Report Builder windows open, and launch SQL Server Management Studio on the SQL server and logon. Expand Security and Logins, right-click on the Reporting Services Point Account (in my lab environment that’s CONTOSO\CM_RS) and choose Properties.
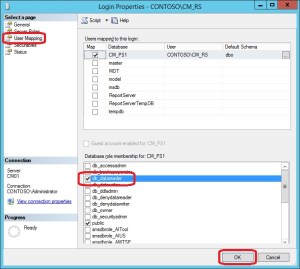
In the left pane, select User Mapping. Under Database role membership for: CM_<site_code> put a check mark next to db_datareader and click OK.
Go back to the Dataset Properties window from before and click on Refresh Fields again. This time around nothing should really happen, which means that it’s working.
18. Click on Table or Matrix.
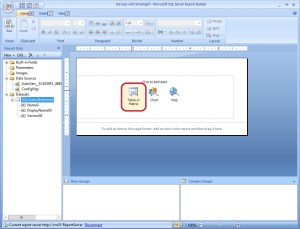
19. Click Next in the New Table or Matrix window (assuming that the correct dataset is choosen, see picture below) .
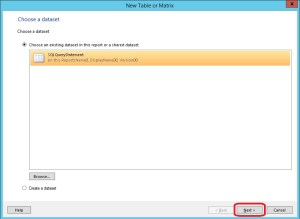
20. Now it’s time to arrange the fields from the SQL query statement in the dataset that we created earlier. There’s no right or wrong here really, it all comes down to how you want to display the results. As shown in the picture below, I’ve dragged and dropped all fields into the Values field. Click Next.
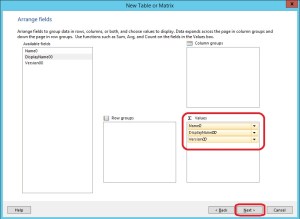
21. On the Choose the layout page, click Next.
22. On the Choose a style page, either choose the default style or select another. I’ve choosen Corporate. Click Finish. At this point we could continue to extend this report, perhaps insert some text above the table with the name of the report, but for this post we’ll not go further.
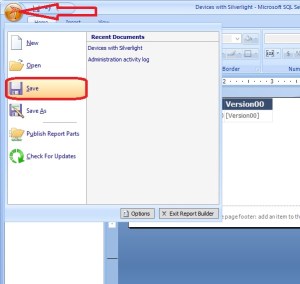
23. Click on the Report Builder button and choose Save.
RUN THE CUSTOM REPORT
Now that we’ve successfully created our custom report, lets go ahead and see how it looks when we run it from within the ConfigMgr console.
1. Go to the Monitoring node. Expand Reporting and then Reports. Scroll down to Software Distribution – Application Monitoring (or the folder you’ve selected when you first created the report).
2. Right-click on the Devices with Silverlight and select Run.
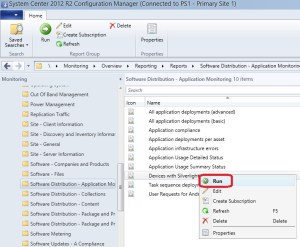
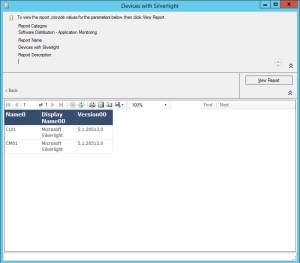
3. Report Viewer will now launch and the results from the SQL query statement should be visible as below:
